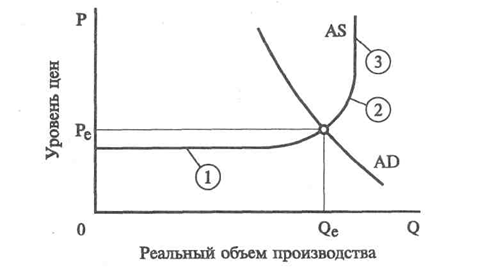
Fig. 3. 1. Combined demand and aggregate supply curve.
Equilibrium standard of prices and equilibrium real national production volume interest rates rise, and growing interest rates, in same queue, result in the cutback of the consumer spending and investments. остатков
2. Effect of riches. Determining the descending trajectory of combined demand curve, there is an effect of riches, or effect real of c a s h tailings. The point is that at a more price-boom the real cost, or purchasing power, accumulated financial assets - in particular, assets with the fixed money cost, such, as urgent accounts or bonds, - being at a population, will diminish. At that rate a population really will become poorer, and it is possible to expect that it will shorten the charges. Family can feel quietly, buying a new car or wind-driven boat, if purchasing power of its financial assets makes, for example, 50 thousands of dol. But if inflation will take purchasing power of these assets, say, to 30 thousand of dol., family can make a decision to set aside the purchase. And vice versa, at the decline of standard of prices the real cost, or purchasing power, material values will grow and holds will be loosened the.
3. Effect of the imported purchases. For example, at the increase of standard of prices in the USA the effect of the imported purchases results in diminishing of the combined demand for American goods and services. And vice versa, the comparative diminishing of standard of prices in the USA is instrumental in reduction of the American import and increase of export and the same to the increase of clean volume of export in the combined demand of the USA.
To understand that results in changes in the volume of national output, it is necessary to distinguish change in the volume of demand on a national product, caused changes in the standard of prices, from changes in the combined demand, caused the changes of one or a few no-price determinants of the combined demand (see of Table 3.1).
Table 3.1. No-price of factors of the combined demand: levers, displacing
a combined demand curve.
|
1. Changes are in consumer charges |
а) Welfare of user |
|
|
б) Expectations of user |
|
|
v) Debt of user |
|
|
g) Taxes |
|
2. Changes are in investment charges |
а) The interest rates |
|
|
б) Expected incomes from investments |
|
|
v) Taxes from the enterprises |
|
|
g) Technology |
|
|
d) Surplus powers |
|
3. Changes are in state charges |
|
|
4. Changes in charges on the net volume of export |
a) A national income in foreign countries |
|
|
б) Rates of exchange |
It is necessary to analyze, as foregoing factors influence on the change of the combined demand. So, for example, growth of welfare and decline of the personal taxes will be caused by the increase of consumer charges and, as a result, displacement of combined demand curve to the right. Expectation of new-wave of inflation will be caused by a that effect, - users will make a decision to purchase commodities to the price increase.
The high level of debt of user, appearing as a result of the former purchasing on a credit, can compel him to shorten today's charges, to pay present debts. Consumer charges will be abbreviated hereupon, and a combined demand curve will be displaced to the left.
Diminishing of interest rates, expectation of more high incomes from investments, decline of taxes from enterprises, invention and necessity of introduction of new technologies, and also absence of surplus powers which can it would be utilized, not coming doing to the large additional charges - all of these factors result in the increase of investment charges and displacement of combined demand curve to the right. The change of foregoing factors with a reverse sign will result in an opposite result and displacement of demand curve to the left.
The increase of the public purchasing of national product at this standard of prices will result in growth of the combined demand until tax collections and interest rates will remain unchanging.
Diminishing of national income has an opposite result abroad: the clean volume of export of country is abbreviated, displacing a combined demand curve to the left. In an analogical result the increase of currency national exchange rate will result to foreign currencies, as a similar course-changing is equivalent a rise in the prices of national products for foreign users and growth of attractiveness of the imported commodities for the buyers of this country.
An aggregate supply is a model, presented on a picture 3-1 as to the curve of AS, which shows the level of the available real production at every possible level of prices volume.
The form of curve of aggregate supply depends on that takes a place with costs on unit of products - and that is why and with prices which must allow enterprises to defray expenses and get an income at the increase of the real national production volume.
The Keyns’s segment of curve (1) is horizontal, because at considerable unemployment it is possible to extend a production without the increase of costs on unit of products and increase of standard of prices.
On an intermediate segment (2), when in a production bottlenecks appear and a less effective equipment and less skilled workers is utilized, costs on unit of products are increased. Therefore on this segment prices must rise at expansion of the real national production volume.
A classic segment (3) corresponds complete busy status; the real national production volume is at maximal level, him it is already impossible to increase, but in reply to the increase of the combined demand the standard of prices will rise.
The curve of aggregate supply can change the position on graphic arts under the action of no-prices factors, determining costs on unit of products (see of Table 3.2). Diminishing of aggregate supply is characterized displacement of curve of aggregate supply and upwards, in other words reduction by a maximal production, limited a classic segment, and increase of minimum standard of prices, limited a Keyns’s segment cutback. An increase in an aggregate supply is determined displacement of curve to the right and downward, in other words by growth of maximal production volume and decline of minimum standard of prices.
Table 3.2. No-price of factors, displacing the curve of aggregate supply
|
1. Price changes on resources |
а) A presence of internal resources |
|
|
- earth |
|
|
- labour resources |
|
|
- capital |
|
|
- enterprise capabilities |
|
|
- prices on the imported resources |
|
|
- domination at the marke |
|
2. A change is in the productivity
|
|
|
3. Changes of legal norms |
а) Taxes from enterprises and subside |
|
|
б) Government control |